How to Get Started with Guardome
Lorem Ipsum is simply dummy text of the printing and typesetting industry. Ipsum has been the industry’s standard dummy.
Onboarding Guardome
unifies, enriches, organizes,
and optimizes your data all in one place
with 24/7 customer support to assist whenever they’re needed.
Send All Your
Telemetry Data Together
Create a Guardome account and send your logs, metrics, traces, and/or security events.
Parse Your
Data
Get your logs & security events parsed by our Customer Support and Team Support.
Organize Data
Across Teams
Segregate data into separate workspaces to drive team autonomy and compliance.
Remove Noisy
Data
Create a Guardome account and send your logs, metrics, traces, and/or security events.
Get Complete
Observability
Get your logs & security events parsed by our Customer Support Team and Team Support.
Organize Data
Across Teams
Segregate data into separate workspaces to drive team autonomy and compliance.
Learn More
Send all your telemetry data together
After creating a Guardome account, the first step is to send telemetry data to Guardome. For those running workloads on Kubernetes, this is a fully automated process described in the steps below. Otherwise, see here for individual integrations.
Instrument with a click
Automatically instrument your applications to expose trace data. There’s no need to manually change your code just a click.
Deploy the agent
Go into the Guardome app and deploy Telemetry Collector by running an auto-generated script on your cluster.
Select the relevant services
Click on Easy Connect, which automatically discovers every service running on your cluster, while providing the option to collect logs, metrics, and or traces from each one.
Parse your log and security event data
There are three ways to parse your log data and security event data with Guardome
Automatic parsing
To see whether your log data or security event data can be automatically parsed by Guardome.
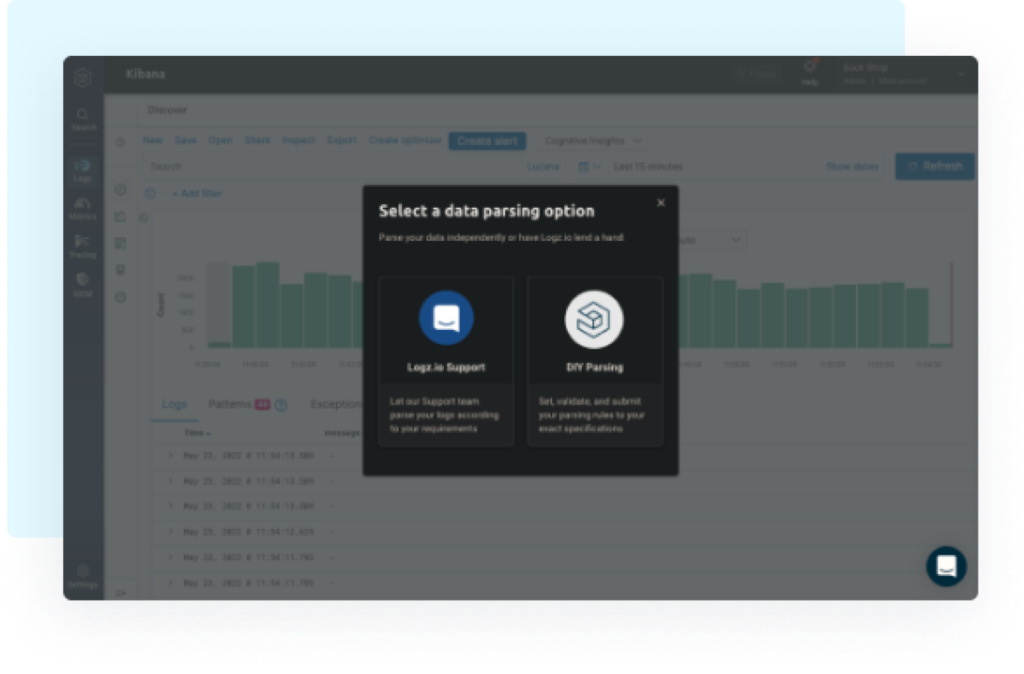
Parsing-as-a-service
Our Support Team will parse your logs for you at any time of day. Simply reach out through the bottom right chatbot within the app to get your logs parsed.
DIY parsing
To learn how to get started with Guardome self-service parsing tool.

Create dedicated workspaces for each team (optional)
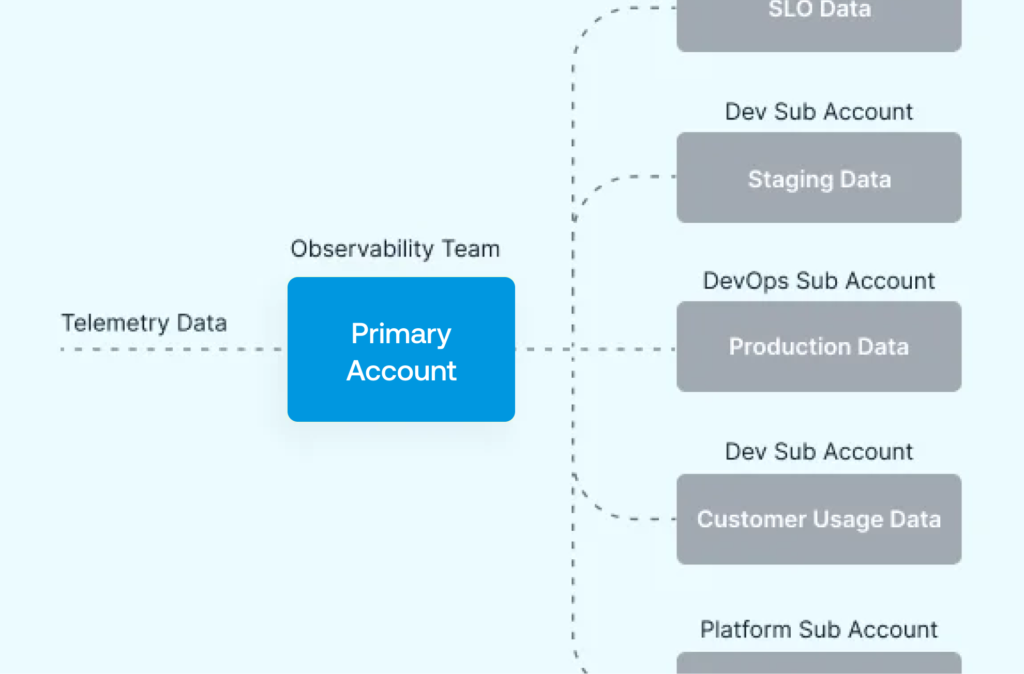
Once your data is in Guardome, segregate it into separate Guardome Sub Accounts and assign user permissions to each account all from a single location. This ensures every team only accesses the data relevant to them to drive autonomy and compliance.
Easily monitor data volumes across teams to find opportunities for cost reduction. Set caps to prevent bursty data from running up your bill.

Eliminate noisy data and optimize storage to reduce costs (optional)
Guardome Data Optimization Manager makes it easy to remove noisy data that needlessly drives up costs and complicates troubleshooting. Use Guardome self-service tools or direct support from our engineers to help identify and remove noisy data through the chat bot in the app.
Further reduce costs with Guardome Cold Search, which enables near real-time analytics on log data stored in AWS S3. Cold Search provides basic log search capabilities on cold storage to dramatically reduce logging costs, with the option to ingest the data to hot storage for more advanced analysis.

Complete observability with Service Overview and Kubernetes 360
With Guardome, you don’t have to set up dashboards; we do it for you. Using our features, you get an out-of-the-box overview of your application and infrastructure health and performance.
Service Overview
Provides immediate insights into the current state of microservices performance an ideal place to begin an incident investigation.
Kubernetes 360
For infrastructure observability, Kubernetes 360 unifies the most critical telemetry data from Kubernetes-based infrastructure in a single view making it easy to spot production issues across your clusters.
Select the relevant services
Build custom monitoring dashboards to identify trends within logs and metrics and to slice and dice your data.

